Hello Everyone,
Here is some of our new features that are available in the latest release. Shout out to the amazing Product team for all their hard work!
REW Insights
REW Insights is a historical view of lead activity displayed as a line graph and is now available on REW CRM’s Dashboard. You can change the data sets and the date range to suit your needs.Check out the REW Insight Video Guide!
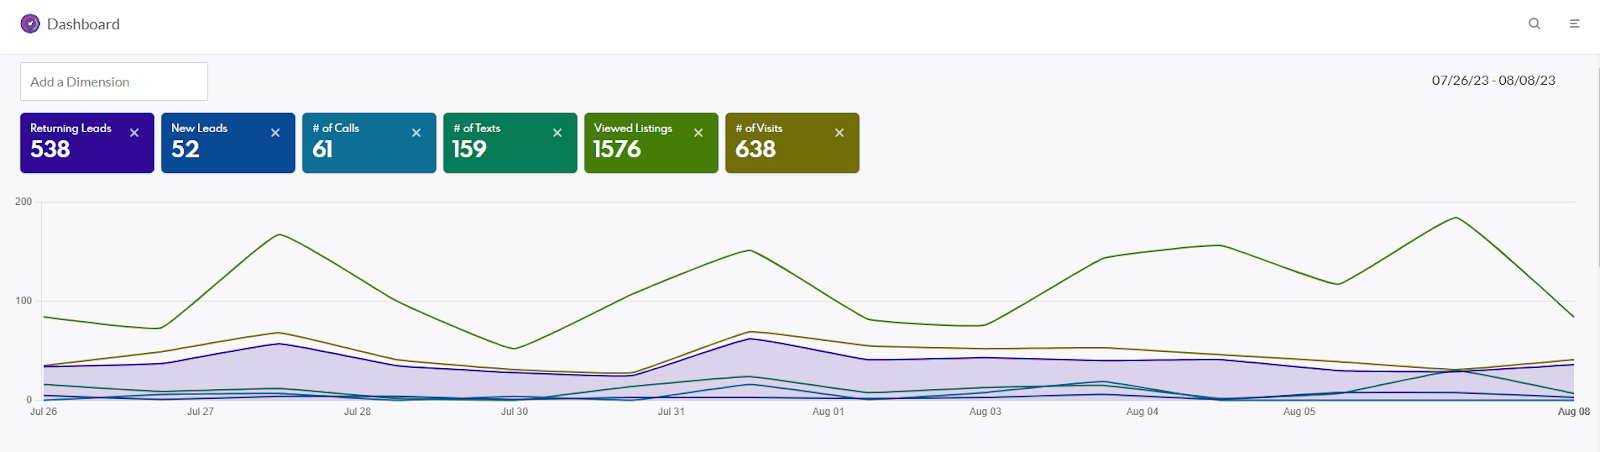
The line graph allows users to visualize crucial metrics summarizing leads interaction with the site and how often agents are contacting these leads. The dimensions that can be added to the graph are:
- New Leads - Number of new leads viewing the site.
- Returning Leads - Number of returning Leads viewing the site.
- Number of Calls - Number of total calls made to assigned Leads
- Number of Emails - Number of total emails made to assigned Leads
- Number of Texts - Number of total texts made to assigned Leads
- Saved Searches - Number of saved searches made by leads
- Viewed Listings - Number of listing details visits made by leads
- Saved Listings - Number of listings saved by leads
- Listing Inquiries - Number of listing inquiries forms submitted by leads
- Form Submissions - Total number of all form submissions (IDX Inquiry, Seller Form, Contact Form, Approve Form, Inquire Form, Seller Capture Form, Home Assessment Form, Home Value Form) made by leads.
- Number of Visits - Total number of leads visits to the site
- Number of Searches - Total number of IDX searches made by leads
- Direct Emails -Number of 1-on-1 email correspondent to leads
Local Logic to Listings
Clients now have the option to add local info and local demographics information to their listings. This provides useful info such as schools and daycare nearby, amenities, transport options and population demographics. This handy video guide will show you how to set up Local Logic and what information you can show on your listings.

Please note REW uses a third party to receive this information, To request this please speak to your Account Manager. It is only available in the US and Canada.
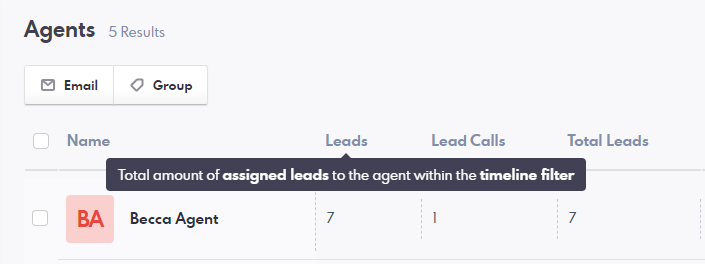
Tooltips for Agent View Columns
All agent view columns will now display a descriptive tooltip when the agent hovers over them. This is to better explain what these columns mean to help you create useful smart lists in the agent view. Here is a quick video guide explaining tool tips and the new deals modal.
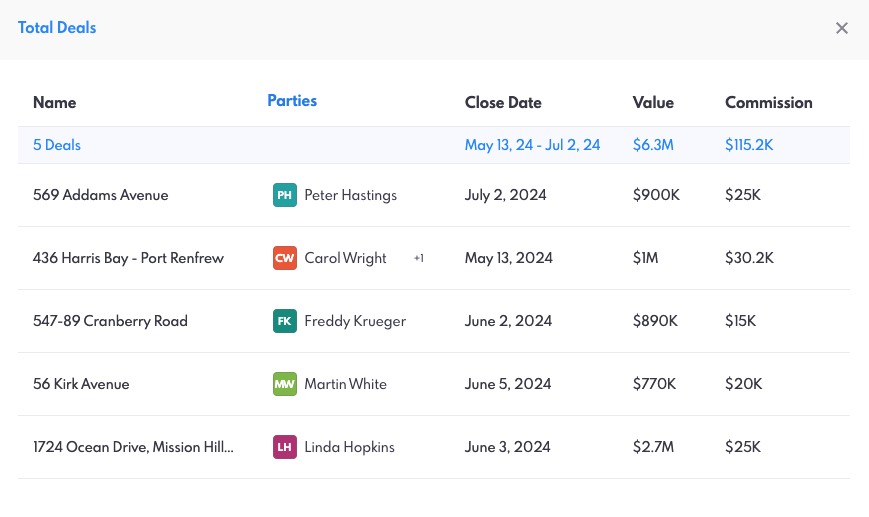
Clickable Deal Modal for Agent view
You are now able to see key information on all the deals that have been created. In the Agent View select the total deal number as it will now be clickable. Once you selected the totals deals a modal will pop-up showing; names, parties, close dates, values and commissions of all deals assigned to Agent.
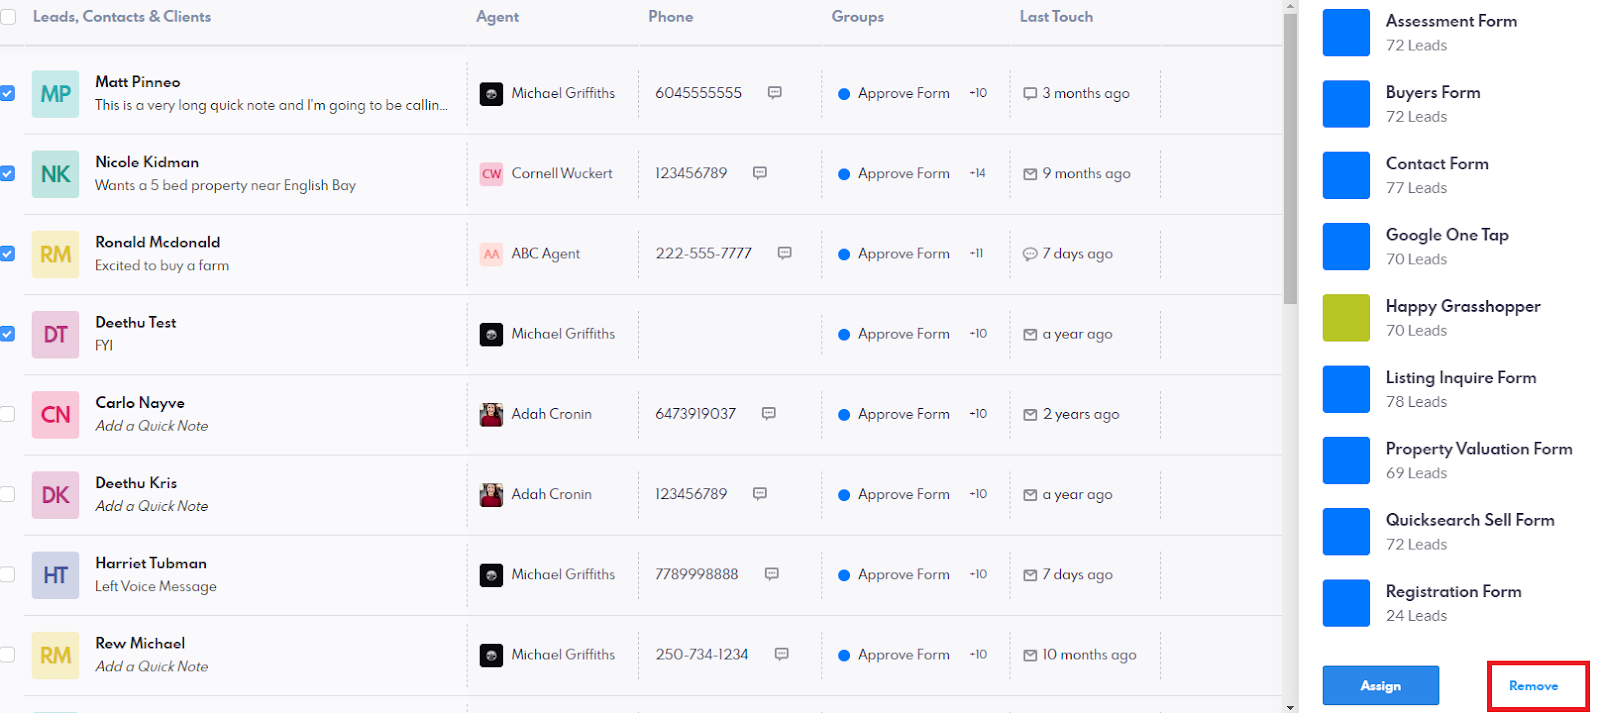
Lead Groups Mass Unassignment
Agents will now have the ability to mass unassign lead groups in the lead view. Simply select the Leads in the Lead view and then select the ‘Groups’’ button, you will see the Group flyout appear on the right hand side of the screen. Select the Group(s) you want removed and select the remove button.
Budget and Commission % fields for Leads
We have added additional fields that Agents can add to the Leads detail page, estimated budget of the Lead and the commission percentage. You will also be able to view these fields in Leads view.
